

ABOUT
SEVEN LIVES
U.S. POLICING
& REFORMS
EDUCATIONAL RESOURCES
SUPPORT
U.S. Policing & Reforms
This section discusses race and policing at a general level, delving into standards for appropriate use of force, and statistical information on police violence.
Police Violence Statistics
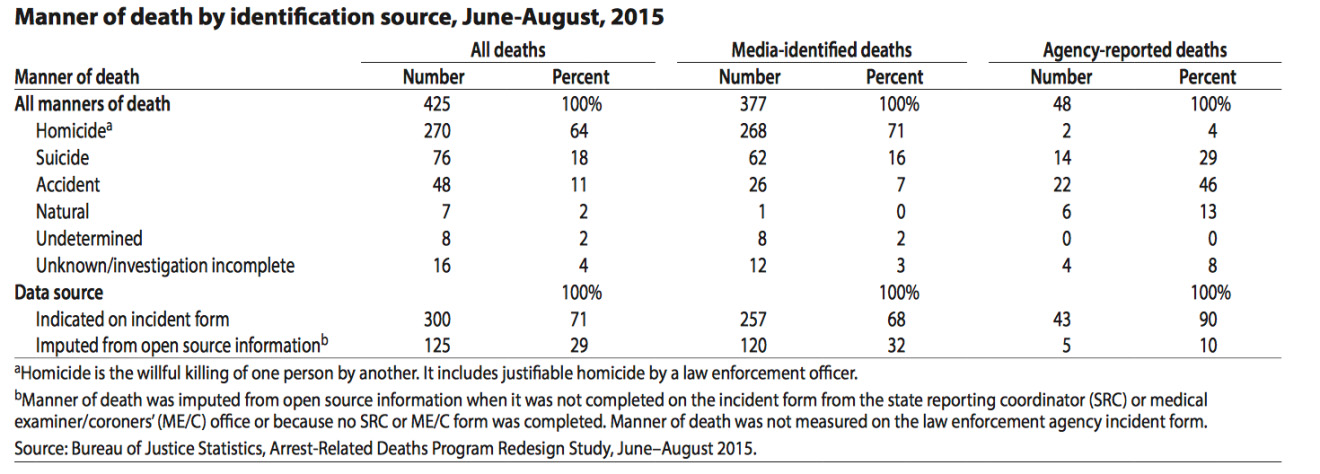
Between June 1, 2015 and March 31, 2016, media reviews done by the Bureau of Justice Statistics (BJS) identified 1,348 potential arrest-related deaths. During this period, the number of deaths consistently ranged from 87 to 156 arrest-related deaths, with an average of 135 deaths per month. To confirm and collect more information about the 379 deaths identified through open sources from June to August 2015, BJS conducted a survey of law enforcement agencies and ME/C (medical examiner/coroners’) offices. The survey findings identified 425 arrest-related deaths during this 3-month period – 12% more than the number of deaths identified through the open source review. Extrapolated to a full calendar year, an estimated 1,900 arrest-related deaths occurred in 2015. Nearly two-thirds (64%) of the deaths that occurred from June to August 2015 were homicides, about a fifth (18%) were suicides, and a tenth (11%) were accidents.
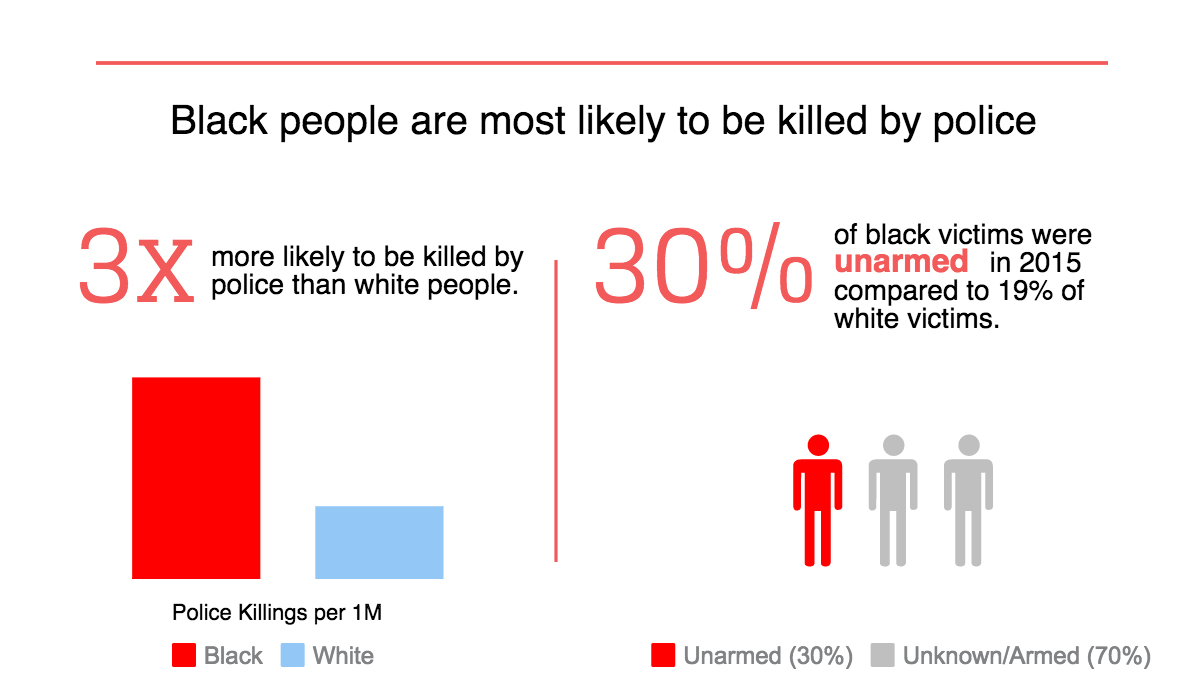
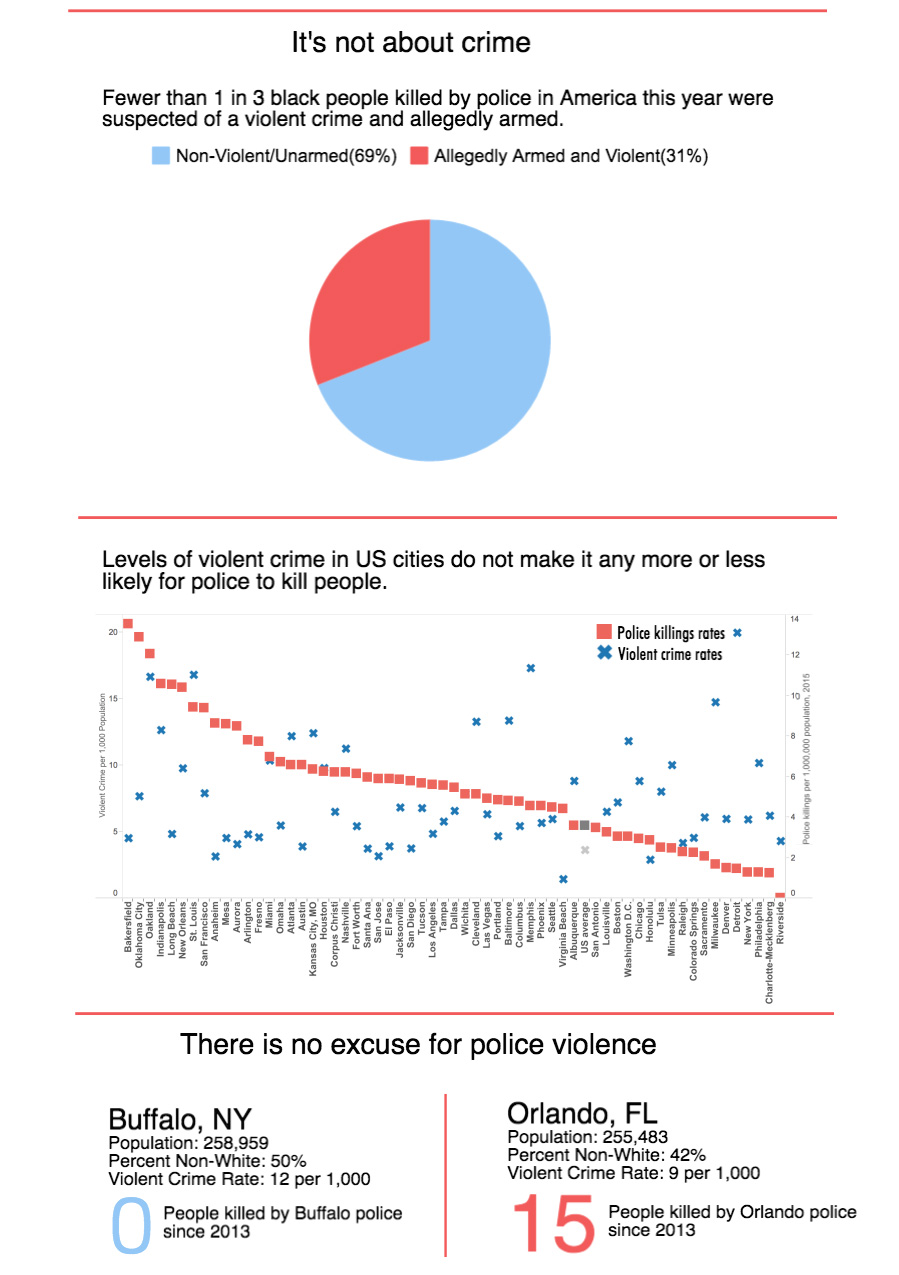
The Washington Post began tracking police violence and, specifically, shootings, in 2015, tracking more than a dozen details about each killing – including the race of the deceased, the circumstances of the shooting, whether the person was armed, and whether the person was experiencing a mental-health crisis. In 2015, 991 people were shot dead by the police. Of this 991, 949 were male, 772 were carrying a deadly weapon (94 were unarmed), 495 were white (258 were black and 172 were Hispanic), and 254 showed signs of mental illness. In 2016, 963 people were shot dead by the police. Of this 963, 519 were armed with guns (48 were unarmed), and 631 were not fleeing the scene.
It is interesting to note that the FBI and the Centers for Disease Control and Prevention also log fatal shootings by police, though these sources are acknowledged by officials to be incomplete. In 2015, The Post documented more than twice as many fatal shootings by police as had been recorded by the FBI. The FBI has announced plans to overhaul how it tracks fatal police shootings in the near future.
Between June 1, 2015 and March 31, 2016, media reviews done by the Bureau of Justice Statistics (BJS) identified 1,348 potential arrest-related deaths. During this period, the number of deaths consistently ranged from 87 to 156 arrest-related deaths, with an average of 135 deaths per month. To confirm and collect more information about the 379 deaths identified through open sources from June to August 2015, BJS conducted a survey of law enforcement agencies and ME/C (medical examiner/coroners’) offices. The survey findings identified 425 arrest-related deaths during this 3-month period – 12% more than the number of deaths identified through the open source review. Extrapolated to a full calendar year, an estimated 1,900 arrest-related deaths occurred in 2015. Nearly two-thirds (64%) of the deaths that occurred from June to August 2015 were homicides, about a fifth (18%) were suicides, and a tenth (11%) were accidents.
The Washington Post began tracking police violence and, specifically, shootings, in 2015, tracking more than a dozen details about each killing – including the race of the deceased, the circumstances of the shooting, whether the person was armed, and whether the person was experiencing a mental-health crisis. In 2015, 991 people were shot dead by the police. Of this 991, 949 were male, 772 were carrying a deadly weapon (94 were unarmed), 495 were white (258 were black and 172 were Hispanic), and 254 showed signs of mental illness. In 2016, 963 people were shot dead by the police. Of this 963, 519 were armed with guns (48 were unarmed), and 631 were not fleeing the scene.
It is interesting to note that the FBI and the Centers for Disease Control and Prevention also log fatal shootings by police, though these sources are acknowledged by officials to be incomplete. In 2015, The Post documented more than twice as many fatal shootings by police as had been recorded by the FBI. The FBI has announced plans to overhaul how it tracks fatal police shootings in the near future.
Sources
Bureau of Justice Statistics, Arrest-Related Deaths Program Redesign Study, 2015-2016: Preliminary Findings (Dec. 2016).
Rich Juzwiak & Aleksander Chan, Unarmed People of Color Killed by Police, 1999-2014, Gawker (Dec. 8, 2014).
Mapping Police Violence, Police Violence Map (Jan. 1, 2017).
Julie Tate, Jennifer Jenkins, Steven Rich, John Muyskens, Kennedy Elliott, Ted Mellnik & Aaron Williams, How The Washington Post is Examining Police Shootings in the United States (July 7, 2016).
The Washington Post, Police Shootings 2015 Database (2015).
The Washington Post, Police Shootings 2016 Database (2016).
CONTACT
RESOURCES & CREDITS